A given dataset can be summarized by measures of central tendency and measures of variability.
Measures of central tendency
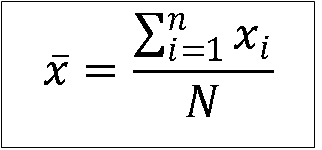
1. Mean (x̄): It is the arithmetic average calculated by summing of all the observations, and dividing the sum by number of observations.
2. Mode: It is the most frequently occuring observation. If there are more than one observation, which are occuring most frequently, then the data is called as bimodal (two modes: two most frequently occuring observations) or multimodal, as the case may be.
3. Median: It is the central observation, when data is arranged in ascending order.
If number of observations are odd, then it is easy to identify the central observation of the sorted data. It is the (N/+1)/2th observation.
When number of observations are even, there are two observations at the centre of the data.These are N/2th and (N/+1)/2th observations. Median is the mean of these two observations.
Measures of variability
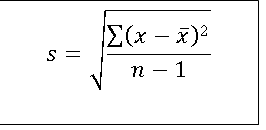
1. Standard deviation (s): It is the Root Mean Squared Deviation, and calculated using following formula.
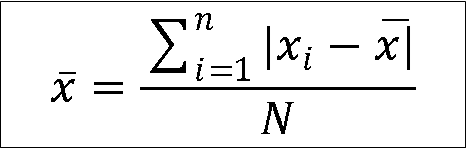
2. Mean deviation: It is the average of the absolute deviation of each observation from mean. It is calculated as follows.
3. Range: It is the maximum - minimum observation.
4. Interquartile range: It is the range between first quartile (25th percentile) and third quartile (75th percentile). Please note that the second quartile is nothing but the median.
5. Coefficient of variation (CV): CV = s*100/x̄ %. It can be used to compare variability between different datasets.
@ Sachin Mumbare