Steps:
1. Null hypothesis and Alternate Hypothesis
Null Hypothesis
A. Two tailed test: Two independent Sample proportions are equal. OR Two independent Sample proportions are not significantly different than each other.
B. One tailed test: (Right tailed): First sample proportion is not more than second sample proportion. OR First sample proportion is equal to or less than second sample proportion.
C. One tailed test: (Left tailed): First sample proportion is not less than second sample proportion. OR irst sample proportion is equal to or more than second sample proportion.
Alternate Hypothesis
A. Two tailed test: Two independent Sample proportions are significantly different than each other.
B. One tailed test: (Right tailed): First sample proportion is significantly more than second sample proportion.
C. One tailed test: (Left tailed): First sample proportion is significantly less than second sample proportion.
2. Calculate Test statistics Z
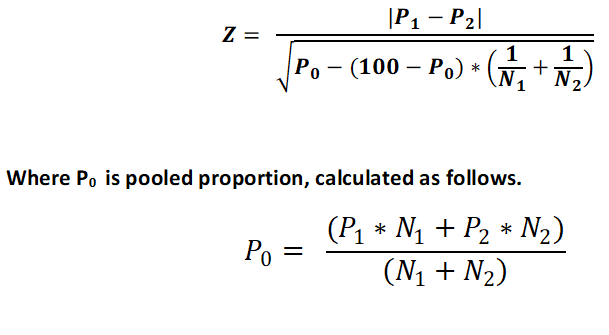
where Z is the test statistics,
P1 = First sample proportion, (In percentage)
P2 =Second sample proportion, (In percentage)
P0 =Pooled proportion, (In percentage)
N1 = Sample Size in first group.
N2 = Sample Size in second group.
If proportions are out of 1, then replace 100 with 1 in above equations.
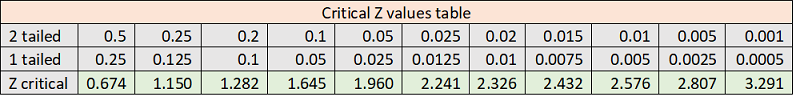
3. Know p value from Z table
4. Interpret
If p < = alpha, then reject Null hypothesis, and accept alternate hypothesis.
If p > alpha, then the study has failed to reject Null hypothesis. So accept Null hypothesis.
Example 1:
A random sample of 50 newborn babies in A city has shown that 13 of them were LBW babies. Another sample of 50 newborn babies from city B has shown that 20 of them were LBW babies. Apply an approriate statistical test to test whether the proportion of LBW babies in these cities is significantly different than each other, at alpha level of 5%.
Here, we want to compare two independent sample proportions. We can apply "Two Sample Z test for proportions."
Here,
P1= 13*100 /50 = 26%, N1 =50, P2= 20*100 /50 = 40%, N2 =50,
alpha = 5%,
tails = 2 (significantly different)
Putting above values at the respective places, we get the output as follows:
p = 0.1366. P value is statistically insignificant at given alpha level of 0.05 (5%). First sample proportion is not significantly different than second sample proportion.
First Sample Proportion = 26%
Second Sample Proportion = 40%
Pooled Proportion = 33%
Standard Error of difference = 9.404254356407(Proportions as percentages)
Z = 1.4886879352069
Alpha = 0.05 (5 %). Critical Z value = 1.95996398451889
p = 0.13656962469167 (Two tailed)
Difference in proportions = -14
95 % Confidence interval of difference in proportions = -32.4319998398126 to 4.43199983981263.
Example 2:
A random sample of 50 newborn babies in A city has shown that 13 of them were LBW babies. Another sample of 50 newborn babies from city B has shown that 20 of them were LBW babies. Apply an approriate statistical test to test whether the proportion of LBW babies in city A is significantly less than city B, at alpha level of 5%.
Here, we want to compare two independent sample proportions. We can apply "Two Sample Z test for proportions."
Here,
P1= 13*100 /50 = 26%, N1 =50, P2= 20*100 /50 = 40%, N2 =50,
alpha = 5%,
tails = 1 (significantly less)
Putting above values at the respective places, we get the output as follows:
p = 0.0683. P value is statistically insignificant at given alpha level of 0.05 (5%). First sample proportion is not significantly less than second sample proportion.
First Sample Proportion = 26%
Second Sample Proportion = 40%
Pooled Proportion = 33%
Standard Error of difference = 9.404254356407(Proportions as percentages)
Z = 1.4886879352069
Alpha = 0.05 (5 %). Critical Z value = 1.64485362699727
p = 0.0682848123458351 (One tailed)
Difference in proportions = -14
95 % Confidence interval of difference in proportions = -∞ to 1.46862188734092.
@ Sachin Mumbare