Whether a data follows normal distribution can be tested by
1. Significance tests for normality: Shapiro Wilk test
2. Histogram
3. Q-Q plot
Shapiro Wilk test:
The Shapiro Wilk test tests the Null Hypothesis that given sample follows normal distribition.
So, if p value is less than the chosen significance level, then the null hypothesis is rejected,
and alternate hypothesis of "non normal distribution" is accepted.
On the other hand, if the p value is greater than the chosen alpha level,
then the null hypothesis of "normally distributed sample" can not be rejected (fails to reject null hypothesis),
and we can "infer" that the data follows normal distribution.
p <= alpha : Non normal distribution
p > alpha : Normal distribution
Other tests of normality.
1. Anderson-Darling test
2. Kolmogorov–Smirnov test (with Liliefors correction)
3. D'Agostino's K-squared test
4. Jarque–Bera test
5. Cramér–von Mises criterion
Histogram
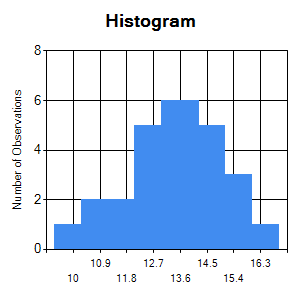
If a sample follows normal distribution then histogram of the sample will be roughly bell shaped, with peak at the middle and tapering peripheries. An example
of histogram of normally distributed data is shown below.
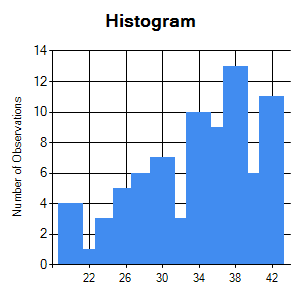
Histogram of a skewed sample will not show peak at centre and tapering peripheries. An example of skewed data is shown below.
Q-Q plot (Quantile - Quantile plot)
The Q-Q plot (quantile-quantile plot), is a graphical representation to visually assess, if a set of data plausibly follows a distribution such as a normal distrbution.
As it depends on individuals visual interpretation, it is somewhat subjective.
The Q-Q plot is a scatterplot created by plotting two sets of quantiles against each other.
One set belonging to the data we need to test and the other set is of normal distribution.
If our data follows normal distribution, then distribution of its quantiles will be similar to quantiles of normal distribution.
Q-Q plot first calculates, expected observations below each quantile and plot them againsts quantiles of given data.
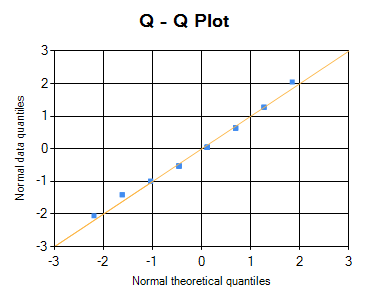
If the data follows normal distribution, then the scatter plot points should follow a central 450 line.
If the points are very close to the central line, it can be assumed that the data follows normal distribution.
Following is an example of Q-Q plot of normally distributed data. (Normal theorical quantiles = quantiles from normally distributed data set.)
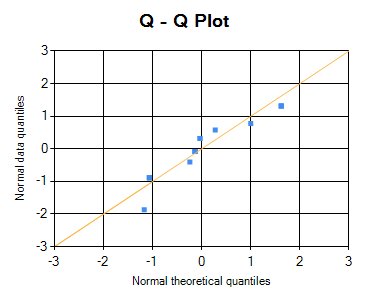
If the points are not close to the central line, it can be assumed that the data does not follows normal distribution.
Following is an example of Q-Q plot of skewed data.
@ Sachin Mumbare