One Sample t test is applied to test whether a sample mean in significantly different / more / less than a known / hypothesized mean, when sample size is less than 30 and population standard deviation is not known.
Steps:
1. Null hypothesis and Alternate Hypothesis
Null Hypothesis
A. Two tailed test: Sample mean is equal to hypothesized mean. OR Sample mean is not significantly different than hypothetical mean.
B. One tailed test: (Right tailed): Sample mean is not more than hypothesized mean. OR Sample mean is equal to or less than hypothesized mean.
C. One tailed test: (Left tailed): Sample mean is not less than hypothesized mean. OR Sample mean is equal to or more than hypothesized mean.
Alternate Hypothesis
A. Two tailed test: Sample mean is significantly different than hypothetical mean.
B. One tailed test: (Right tailed): Sample mean is significantly more than hypothesized mean.
C. One tailed test: (Left tailed): Sample mean is significantly less than hypothesized mean.
2. Calculate Test statistics t
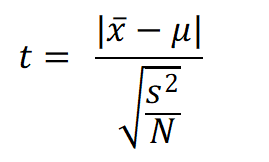
where t is the test statistics,
x̄ = Sample mean,
μ = hypothesized / known / population mean,
s = sample Standard deviation,
N = Sample Size
3. Calculate Degrees of freedom (df).
df= N - 1
4. Know p value from t table
5. Interpret
If p < = alpha, then reject Null hypothesis, and accept alternate hypothesis.
If p > alpha, then the study has failed to reject Null hypothesis. So accept Null hypothesis.
Confidence Intervals
1. For two tailed test:
100 - alpha % confidence interval = x̄ ± critical_t_value * SE mean
where critical_t_value is the t table value corrsponding to 2 tailed test, given alpha and degrees of freedom.
SE mean = sqrt (s2 / N)
1. For one tailed test:
A. Right tailed test (AH = Sample mean is significantly more than hypothesized mean)
100 - alpha % confidence interval = x̄ - critical_t_value * SE mean to infinity.
where critical_t_value is the t table value corrsponding to 1 tailed test, given alpha and degrees of freedom.
B. Left tailed test (AH = Sample mean is significantly less than hypothesized mean)
100 - alpha % confidence interval = minus Infinity to x̄ + critical_t_value * SE mean.
where critical_t_value is the t table value corrsponding to 1 tailed test, given alpha and degrees of freedom.
Example 1:
A sample of 15 premature birth children has shown mean IQ of 98 ± 5. Apply an approriate statistical test to test whether premature born children have significantly different IQ than population average of 100, at alpha level of 5%.
As N < 30 and population standard deviation is not known, appropriate statistical test will be "One Sample t test."
Here,
x̄ = 98
s = 5
μ = 100
N = 15
alpha = 5%
tails = 2 (significantly different). Putting above values at the respective places, we get the output as follows:
p = 0.1436. P value is statistically insignificant at given alpha level of 0.05 (5%). Sample mean is not significantly different than hypothesized / known mean.
Sample Mean ± SD = 98 ± 5
Hypothesized / known Mean = 100
Standard Error of Mean = 1.291
t = 1.549
df = 14
p = 0.1436(Two tailed)
Alpha = 0.05 (5 %). Critical t value = 2.145
95 % Confidence interval = 95.231 to 100.769
Example 2:
A sample of 15 premature birth children has shown mean IQ of 98 ± 5. Apply an approriate statistical test to test whether premature born children have significantly less IQ than population average of 100, at alpha level of 5%.
As N < 30 and population standard deviation is not known, appropriate statistical test will be "One Sample t test."
Here,
x̄ = 98
s = 5
μ = 100
N = 15
alpha = 5%
tails = 1 (significantly less)
Putting above values at the respective places, we get the output as follows:
p = 0.0718. P value is statistically insignificant at given alpha level of 0.05 (5%). Sample mean is not significantly less than hypothesized / known mean.
Sample Mean ± SD = 98 ± 5
Hypothesized / known Mean = 100
Standard Error of Mean = 1.291
t = 1.549
df = 14
p = 0.0718(One tailed)
Alpha = 0.05 (5 %). Critical t value = 1.761
95 % Confidence interval = -∞ to 100.274