Student's t test is applied to compare two independent sample means, when sample size is less than 30 / population standard deviation is not known.
Assumptions
1. Data is continuous and normally distributed.
2. Samples are drawn using random sampling technique.
3.. Variances of these two samples are equal.
Steps:
1. Null hypothesis and Alternate Hypothesis
Null Hypothesis
A. Two tailed test: Two independent sample means are equal. OR Sample means are not significantly different than each other.
B. One tailed test: (Right tailed): First Sample mean is not more than second sample mean. OR First Sample mean is equal to or less than second sample mean.
C. One tailed test: (Left tailed): First Sample mean is not less than second sample mean. OR First Sample mean is equal to or more than second sample mean.
Alternate Hypothesis
A. Two tailed test: Sample means are significantly different than each other.
B. One tailed test: (Right tailed): First Sample mean is significantly more than second sample mean.
C. One tailed test: (Left tailed): First Sample mean is significantly less than second sample mean.
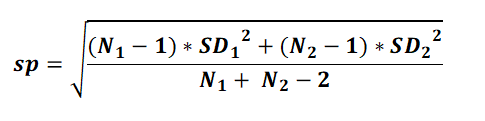
2. Calculate Test statistics t
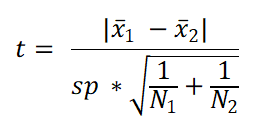
Where,
where t is the test statistics,
x̄ = Sample means
for first or second sample, respective to its subscript.
SD = sample Standard deviations for first or second sample, respective to its subscript,
N = Sample Size
in first or second sample, respective to its subscript.
3. Calculate Degrees of freedom (df).
df= N1 + N2 - 2
4. Know p value from t table
5. Interpret
If p < = alpha, then reject Null hypothesis, and accept alternate hypothesis.
If p > alpha, then the study has failed to reject Null hypothesis. So accept Null hypothesis.
Confidence Intervals
1. For two tailed test:
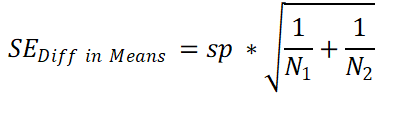
100 - alpha % confidence interval = Actual difference in means ± critical_t_value * SE Diff in means
where critical_t_value is the t table value corrsponding to 2 tailed test, given alpha and degrees of freedom.
1. For one tailed test:
A. Right tailed test (AH = Sample mean is significantly more than hypothesized mean)
100 - alpha % confidence interval = Actual difference in means - critical_t_value * SE Diff in means to infinity.
where critical_t_value is the t table value corrsponding to 1 tailed test, given alpha and degrees of freedom.
B. Left tailed test (AH = Sample mean is significantly less than hypothesized mean)
100 - alpha % confidence interval = minus Infinity to Actual difference in means + critical_t_value * SE Diff in means
where critical_t_value is the t table value corrsponding to 1 tailed test, given alpha and degrees of freedom.
F test for Equality of variance.
To test for equality of variance F test can be allpied.
F = (SD L / SDS) 2
where, SDL is the larger SD and SDS is the smaller SD of the two samples.
Null hypothesis of the F test is that the sample variances are equal.
Alternate hypothesis is sample variances are unequal.
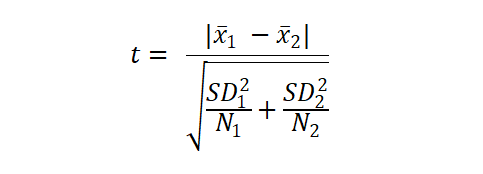
So, if F test gives significant p value, then AH of unequal variances is accepted. In this situation, Welch's t test is applied instead of Student's t test. Welch's t test is almost similar to the Student t test, except that formulae for t statistics and degrees of freedom are different.
Welch's t test, t statistics is given by
Degrees of freedom (df) for Welch's t test is given by
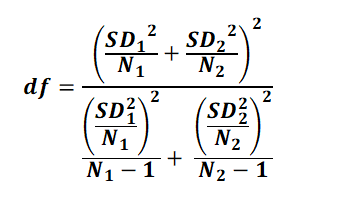
Please note here that df can be a non-integer value. Software programmes are needed to calculate critical t value and p value for this df.
Example 1:
Random samples of 15 boys and 20 girls have shown mean IQ of 98 ± 6 and 100 ± 5, respectively. Apply an approriate statistical test to test whether there is gender-wise significantly difference in IQ, at alpha level of 5%.
As N < 30 and population standard deviation is not known, appropriate statistical test will be "Independent samples t test."
Here,
x̄ 1 = 98
SD1 = 6
x̄ 2 = 100
SD1 = 5
N1= 15
N2= 20
alpha = 5%
tails = 2 (significantly different).
Putting above values at the respective places, we get the output as follows:
F test gives p value of 0.226, which is non-significant at given alpha level of 0.05. So we can accept NH of equal variances. So also, we can use Student's t test results.
t= 1.075, df = 33, p = 0.29
As p > alpha of 0.05, p is non-significant. We can say that there is no statistically significant difference between IQs in these two groups.