A chi-square test can test whether there is association between two categorical variables: for example, Ca lung (Two levels: Yes or No) and Smoking (Two levels: Yes or No). If smoking has three levels (No smoking, irregular smoking and regular smoking), chi-square test
can also test the association between Ca lung and smoking status.
However, if you want to test, whether there is a trend, meaning increase in level of smoking is also associated with increased disease, then Chi-square test for trends is used.
So, Chi-square test for trends tests whether there is a trend in association between a dichotomous outcome variable and ordinal
independent variable, with more than two levels.
Example:
In a reserch study, conducted to find the association of Hypertension and Exercise, following are the results.
| Sr |
Exercise Status |
Hypertension |
No hypertension |
Total |
| 1 |
No Exercise |
50 |
25 |
75 |
| 2 |
Irregular exercise |
40 |
40 |
80 |
| 3 |
Regular exercise |
30 |
50 |
80 |
| 4 |
Total |
120 |
115 |
235 |
We can apply Chi-square test for trends to test trend in association between level of exercise and hypertension.
Solution:
There are three levels of exercise: No, irregular and regular exercise.
The baseline level can be selected as "No exercise", and then irregular exercise and regular exercise are increasing levels. This data can be put in the available text boxes as follows.
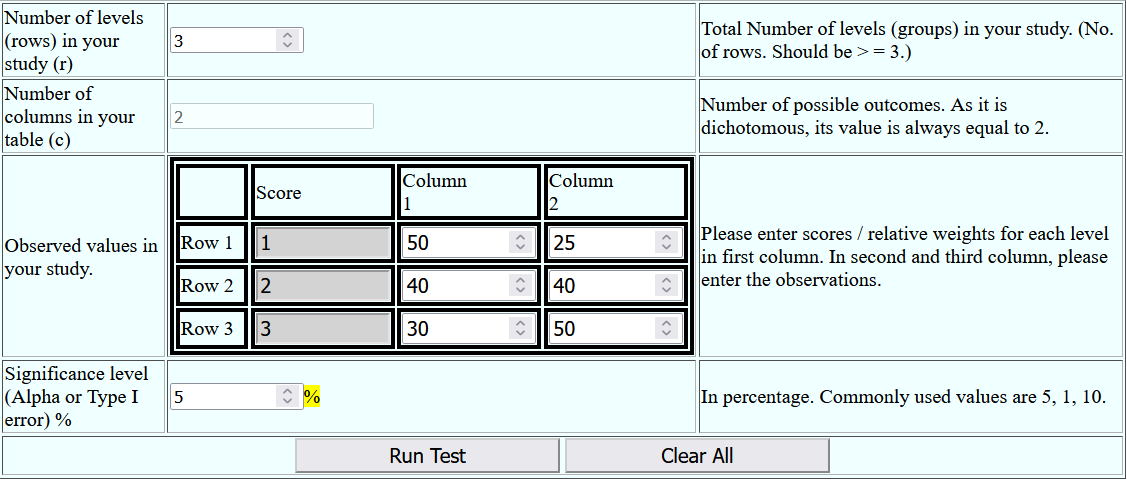
Please note that, the scores for three levels are selected as 1, 2 and 3 respectively. You can select any score, in increasing order, for increasing level of independent variable, depending upon the impact of the level. (This can be thought as specifying a "weight" for each level).
After entering significance level (5% in above example), you can click on "Run Test" to get following output. The p value is significant, means there is significant trend. (Increased "level" of exercise is significantly associated with hypertension. In this example, we can see that, with increased "level" of exercise, there is decreasing trend in hypertension.)
Results
Chi Square for trends = 13.1413, df = 1
Z = -3.6251
p = 0.00029
The p value is significant at alpha = 0.05.
Steps
1. Null hypothesis and Alternate Hypothesis
Null Hypothesis
There is no trend in dependent variable with increasing levels of independent variable
Alternate Hypothesis
There is significant trend in dependent variable with increasing levels of independent variable
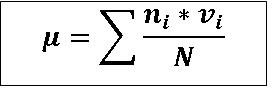
2. Chi-square value is calculated using following formula.
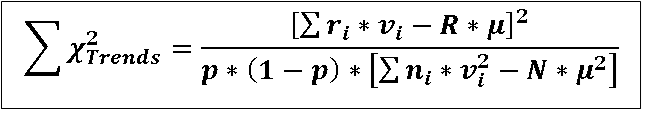
Where ri is the observed value for "Yes" in ith row, vi is the score for ith row, R is the sum of all "Yes", ni is the
row total of ith row, N is the grand total, and p=R/N.
3. Degrees of freedom (df) = 1 (always 1, as only one value will determie all others, as per the trend)
4. Based on Chi-square value and df=1, p value is calculated using chi-square table.
5. If p < = alpha, reject the null hypothesi. Accept the alternate hypothsis
If p > alpha, accept the null hypothesis (study failed to reject NH)
Reference:
Armitage P, Berry G. Statistical Methods in Medical Research (3rd edition). Blackwell 1994
@ Sachin Mumbare