McNemar chi-square test is used when the design is matched pair design. Suppose a case control study is conducted to find the association of smoking and Ca tongue. To eliminate the effect of possible confounding because of tobacco chewing, one matched control for each case is selected (matching with respect to tobacco chewing status). In other words, if the case is tobacco chewer, then tobacco chewer control is selected and matched with that case (1:1 matching).
Then for each pair of case-control, the exposure to smoking is evaluated. Accordingly, each pair will belong to one of the following four categories.
A. Case and controls both not exposed to smoking.
B. Case exposed to smoking but control not exposed to smoking.
C. Case not exposed to smoking but control exposed to smoking.
D. Case and control both not exposed to smoking.
Then number of pairs in each of the above categories are totalled.
Suppose, following is the number of pairs in each category.
Case and controls both not exposed to smoking = 20
Case exposed to smoking but control not exposed to smoking = 50
Case not exposed to smoking but control exposed to smoking = 10
Case and control both not exposed to smoking = 30
The above findings can be entered in respective cells as follows:
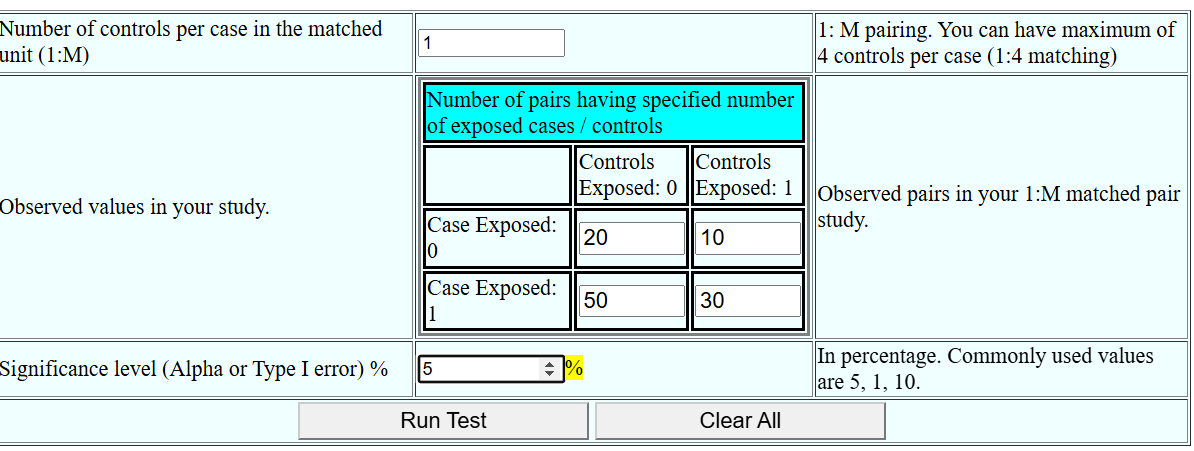
Please note that, in above table 20 represents number of pairs with 0 cases exposed and 0 controls exposed. Similarly, 10 represents number of pairs with 0 cases exposed and 1 control exposed. (Please see 1:M matching for more clarification). The grand total of 110 represents the total pairs in the study. The grand total does not represent total subjects in the study. In the above example, there are 110 pairs, so total subjects in the study are 220.
After entering significance level of 5%, click on “Run Test” to get following output.
Results
Chi Square = 25.35
Degrees of freedom = 1
p = 0 (meaning < 0.0001)
The p value is significant at alpha = 0.05.
Odds Ratio = 5
1:M matching
Sometimes, to incrase the power, number of matched can be more than 1. So there can be 1:2 matching (two matched controls for each case) forming a triplet, or 1:3 (three matched controls for each case) forming a quadruplet.
Maximum number of matched controls for each case can be 4. More than 4 controls per case does not help much in increasing the power.
If there is 1:2 matching, there are triplets, each consisting of one case and two controls. These triplets can be classified into one of the following six categories, according to the number of cases and controls exposed, as follows
A. No case and no control is exposed.
B. No case and 1 control is exposed.
C. No case and both controls are exposed.
D. One (the only) case and no control is exposed.
E. One case and 1 control is exposed.
F. One case and both controls are exposed.
If respective number of triplets from A to F are 10, 15, 20, 25, 35 and 20 respectively, then the data can be enetred as follows.
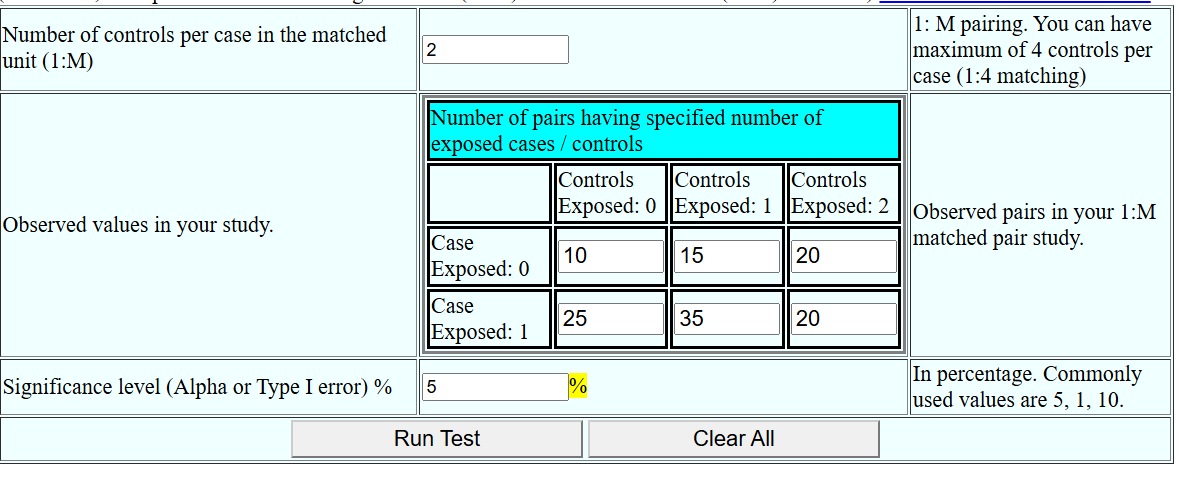
Following is the output
Steps
1. Null hypothesis and Alternate Hypothesis
Null Hypothesis
There is no association between the variables.
Alternate Hypothesis
There is significant association between the variables.
2. Test Statistics
(McNemar) Chi-squares value is calculated using the formuls
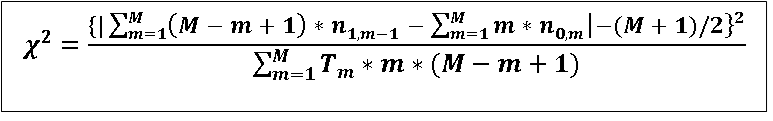
Where,
M = Number of controls per case (matching ratio)
n1,k = Number of pairs in which the case is exposed and k controls are exposed. (n1,2 = Number of pairs in each the case
is exposed and exactly 2 controls are exposed.)
n0,k = Number of pairs in which the case is not exposed and k controls are exposed. (n0,2 = Number of pairs in each the case
is not exposed and exactly 2 controls are exposed.)
Tk = n1,k-1 + n0,k
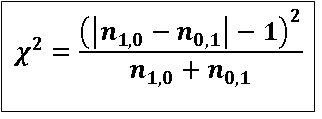
When M=1 (1:1 pair matching), above formula simplifies to
3. Degrees of freedom
df = M
4. P value
Based on df and calculated chi-square value, p value is calculated using either chi-square table or a software.
5. Interpretation
If p < = alpha, reject the null hypothesi. Accept the alternate hypothsis.
If p > alpha, accept the null hypothesis (study failed to reject NH)
@ Sachin Mumbare