Example:
A researcher wants to find whether there is significant difference in proportions of various blood groups amongst doctors than general population. The study has revealed that the number of doctors with blood groups A, B, AB and O were 20, 40, 15 and 10 respectively. The expected values for these 85 doctors, based on population proportions of blood groups were 20, 35, 10 and 20 respectively. Can we say that the observed numbers are significantly different than the expected, at alpha of 0.05 (5%)?
Solution:
Here
Alpha= 5%, Observed values are 20, 40, 15 and 10, corresponding expected values are 20, 35, 10 and 20
After putting these values, following output.
Results
Descriptive:
| Sr |
Observed value |
Observed Percentage |
Expected Value |
Expected Percentage |
| 1 |
20 |
23.53 % |
20 |
23.53 % |
| 2 |
40 |
47.06 % |
35 |
41.18 % |
| 3 |
15 |
17.65 % |
10 |
11.76 % |
| 4 |
10 |
11.76 % |
20 |
23.53 % |
Chi square = 8.2143
df = 3
p = 0.041785
Alpha (Type I error) = 5
The calculated p value is significant at alpha = 0.05
The observed proportions are significantly different than expected proportions.
Steps
1. Null hypothesis and Alternate Hypothesis
Null Hypothesis
The observed proportions are equal to the expected proportions in given groups.
Alternate Hypothesis
The observed proportions are significantly different than the expected proportions in given groups.
2. Chi-square value is calculated using following formula.
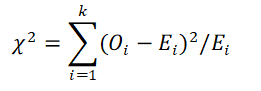
Where Oi is the observed value and Ei is the expected value for the group.
3. Degrees of freedom (df) = r -1 (Where r = number of groups)
4. Based on Chi-square value and df, p value is calculated using chi-square table.
5. If p < = alpha, reject the null hypothesi. Accept the alternate hypothsis
If p > alpha, accept the null hypothesis (study failed to reject NH)
@ Sachin Mumbare