Aim: Sample Size: Hypothesis testing for Odds Ratio (RR) in case control study. Null Hypothesis: OR =1.
Null hypothesis: RR =1
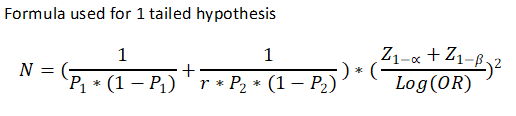
Formula Used

To calculate P1 or P2 or OR, when other two are known
P1 = OR * P2 / (1 - P2 + OR * P2)
P2 = P1 / (OR – OR * P1 + P1)
OR = P1 * (1 – P2) / (P2 * (1 – P1))
OR = Anticipated Odds Ratio
P1 = Estimated Proportion of Cases exposed to risk factor (out of 1) (e.g. 25% = 0.25)
P2 = Estimated Proportion of Controls exposed to risk factor (out of 1) (e.g. 15% = 0.15)
r= Controls to Cases ratio
α = 1 – Confidence level (out of 1) (e.g. 95% confidence level = 0.95, α = 0.05)
Z 1-α/2 = the standard normal deviate corresponding the confidence level
Z 1-β = the standard normal deviate corresponding to power (out of 1)
Example:
A case control study is planned to test whether less attendance in class (exposure) is a significant risk factor for failure in final examination (outcome). A pilot study has revealed that the proportion of students with less attendance in failures and pass students were 20% and 5%, respectively. How much sample size shall be required to identify attendance as a significant risk factor for failure (two tailed), at 95% confidence level, 80% power? (Controls: Cases = 1)
Solution:
Here
P1 = 20%, P2=5%, Confidence level = 95%, Power = 80 %, tails=2
After putting these values, we get required sample size in each group = 89.
We also get the estimated OR = 4.75.
Alternate methods:
The formula for sample size in case group, for 2 tailed test, described by Kelsey et al. (For 1 tailed test, please replace α /2 with α.)
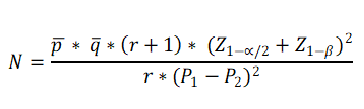
Where
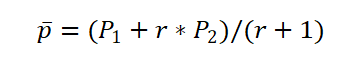
The formula for sample size in case group, for 2 tailed test, described by Fleiss et al. without continuity correction. (For 1 tailed test, please replace α /2 with α.)
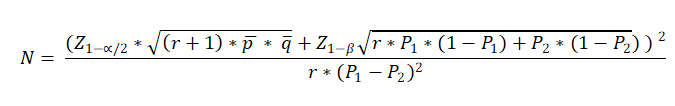
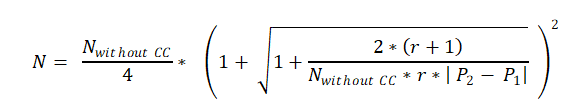
The formula for sample size in case group, for 2 tailed test, described by Fleiss et al. with continuity correction. (For 1 tailed test, please replace α /2 with α in the formula for Nwithout CC.)
@ Sachin Mumbare