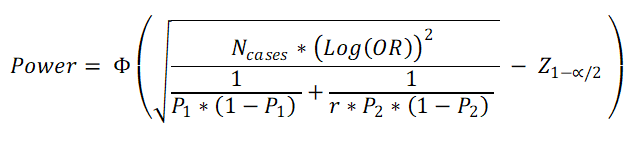
Formula Used for 2 tailed hypohesis
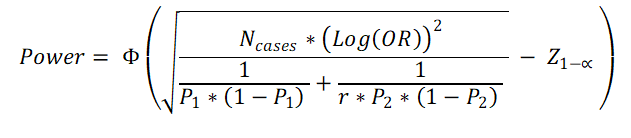
Formula Used for 1 tailed hypohesis
To calculate P1 or P2 or OR, when other two are known
P1 = OR * P2 / (1 - P2 + OR * P2)
P2 = P1 / (OR – OR * P1 + P1)
OR = P1 * (1 – P2) / (P2 * (1 – P1))
OR = Odds Ratio
P1 = Proportion of Cases exposed to risk factor (out of 1) (e.g. 25% = 0.25)
P2 = Proportion of Controls exposed to risk factor (out of 1) (e.g. 15% = 0.15)
Ncases = Sample Size in Case group
r = Controls to Cases ratio = Ncontrols / Ncases
α = 1 – Confidence level (out of 1) (e.g. 95% confidence level = 0.95, α = 0.05)
Z 1-α/2 = the standard normal deviate corresponding the confidence level
Φ(x)=P(Z ≤ x). It is the cumulative distribution function (CDF) of normal distribution. Simply, it is the area of the standard normal curve towards left side of x.