Aim: To Calculate Sample Size for Clinical trial: Non-inferiority design (Outcome variable - Ratio)
Formula Used
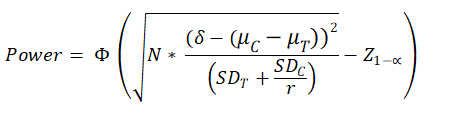
N = Sample size in test arm = N1
μT = Estimated mean in test (experimental) group (test drug / therapy)
μC = Estimated mean in control group (Known drug / thearpy etc)
SDT = Estimated standard deviation in test (experimental) group (test drug / therapy)
SDC = Estimated Estimated standard deviation in control group (Known drug / thearpy etc)
δ= Non-inferiority margin
r= Sample size in Control group : Sample Size in Cases group = N2 / N1
Z 1-α = the standard normal deviate corresponding the confidence level
Φ(x)=P(Z ≤ x). It is the cumulative distribution function (CDF) of normal distribution. Simply, it is the area of the standard normal curve towards left side of x.
What is non-inferirity margin?
It is the clinically acceptable difference between μC and μT to define non-inferiority.
In other words, even if μT is less than μC, but the difference is less than δ, then μT can be considered as non-inferior to μC.
Null hypothesis and alternate hypotheis in non-inferiority design are as follows.
H0: μC - μT > δ (implying μT is inferior)
The alternate hypothesis will be
μC - μT < = δ (implying μT is not inferior to μC; difference between μC and μT is less than the clinically acceptable non-inferiority margin )
Example:
A non-inferiority trial is conducted to test non-inferiority of a new antihypertensive drug T with a known antihypertensive drug C. Mean reduction in SBP with a new and known antihypertensive drug is 30 ± 6 and 35 ± 6 mm of Hg. The trial is conducted by including 50 participants in each group. How much was the power of the trial to detect non-inferiority, if non-inferiority margin is decided as 8 mm of Hg, confidence level of 95%.
Solution:
Here
μT = 30, μC = 35, SDT = SDC = 6, δ = 8, confidence level = 95%, N1=N2=50.
After putting these values, we get power = 80.38%.
Shein-Chung Chow, Jun Shao, Hansheng Wang. Sample Size Calculations in Clinical Research Second Ed. Chapman and Hall/CRC Biostatistics Series 2008.