Aim: To calculate statistical power gained with given Sample Size for Clinical trial: Superiority design (Outcome variable - dichotomous)
Formula Used
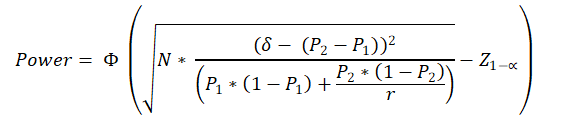
N = Sample Size in test group (N1).
P1 = Estimated proportion of success in test group (test drug / therapy) (out of 1) (e.g. 25% = 0.25) = Successful outcomes in test group / total participants (sample size) in test group
P2 = Estimated proportion of success in control group (Known drug / thearpy etc) (out of 1) (e.g. 15% = 0.15) = Succesful outcomes in control group / total participants (sample size) in control group
δ = Superiority margin (Out of 1) (e.g. 5% = 0.05). Has to be less than the difference between P2 and P1.
r = Sample size in Control group : Sample Size in test group = N2 / N1
Z1-α = the standard normal deviate corresponding the confidence level
Φ(x)=P(Z ≤ x). It is the cumulative distribution function (CDF) of normal distribution. Simply, it is the area of the standard normal curve towards left side of x.
What is superiority margin (δ)?
It is the margin by which test arm success proportion should be more than control arm success proportion, to define superiority.
In other words, only if P1 is more than P2 by a mrgin of δ, superiority of P1 is defined.
Null hypothesis and alternate hypotheis in superiority design are as follows.
H0: P1 - P2 < δ (implying P1 is not superior)
The alternate hypothesis will be
P1 - P2 > = δ (implying P1 is superior to P2; difference between P1 and P2 is more than the superiority margin )
If null hypothesis is rejected, then alternate hypothesis of superiority is accepted.
Example:
A superiority trial is conducted to test superiority of a new drug as compared with a known drug. Success rates of the test drug and known drug are 75% and 60%. The trial was conducted with 200 participants in each arm. How much was the power of the trial to detect superiority, if superiority margin is decided as 5%, confidence level of 95%.
Solution:
Here
P1 = 75% so number of successful outcomes = 150 , P2 = 60% o number of successful outcomes = 120, δ = 5%, confidence level = 95%,
δ = 5%, which is less than P1 - P2.
After putting these values, we get required power = 69.78%
Please note that the superiority margin (δ) has to be less than the difference between P1 and P2.
Mathematically it is possible to calculate the power using given formula, even if δ is more than difference between P1 and P2. However, this will give erroneous results, because even with infinite sample size we can not prove superiority, if δ > P1 - P2, and power will always be 0.
Because, if the difference between success rates is less than the superiority limit, then it is already assumed that test arm success rate is already below the success rate of control (known) arm + δ. In this situation, whatever sample size we take, it will not be possible to reject the null hypothesis.
Shein-Chung Chow, Jun Shao, Hansheng Wang. Sample Size Calculations in Clinical Research Second Ed. Chapman and Hall/CRC Biostatistics Series 2008.
Xiaofeng Wang, Xinge Ji. Sample Size Formulas for Different Study Designs Supplement Document for Wang, X. and Ji, X., 2020. Sample size estimation in clinical research:
from randomized controlled trials to observational studies. Chest, 158(1), pp.S12-S20.