Aim: To Calculate Sample Size to estimate Relative Risk (RR) with specified precision in cohort study.
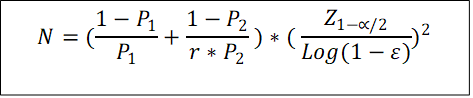
Formula Used
To calculate P1 or P2 or OR, when other two are known
P1 = RR * P2
P2 = RR * P1
RR = P1 / P2
RR = Anticipated Relative Risk
P1 = Anticipated Incidence amongst exposed (out of 1) (e.g. 25% = 0.25)
P2 = Anticipated Incidence amongst non-exposed (out of 1) (e.g. 25% = 0.25)
ε = Precision / Allowable error (Out of 1) (e.g. 25% = 0.25)
r= Non-exposed (controls) : Exposed (Cohort) ratio
Z 1-α/2 = the standard normal deviate corresponding the confidence level
Example:
A cohort study is planned to estimate the RR, associated with less attendance (risk factor) and failure in final examination (outcome). A pilot study has revealed that the incidence of failures amongst less attendees and regular attendees is 30 % and 10 % respectively. How much sample size shall be required to estimate the Relative Risk within 25% of its true value, at 95% confidence level, and Controls: Cohort = 1?
Solution:
Here
P1 = 30%, P2=10%, Confidence level = 95%, precision = 25%
After putting these values, we get required sample size in each group = 526.
We also get the estimated RR=3.
What will happen after selecting this sample size, considering we get the results with anticipated incidence rates?
If we take 526 students in each group, we are anticipating our results as follows, considering incidence rates of 30% and 10% in exposed (less attendees) and non-exposed (regular attendees). (Actual data can not have fractions, but to maintain desired incidence rates, we have not converted them to integers.)
|
Less Attendance (Exposed) |
Adequate Attendance (Non exposed) |
Total |
| Failures |
157.8 (a) |
52.6 (b) |
210.4 |
| Pass |
368.2 (c) |
473.4 (d) |
841.6 |
| Total |
526 |
526 |
1052 |
RR = (157.8/526) / (52.6/526) = 3
Log RR = 1.099
SE of Log RR = SQRT (1/a + 1/b - 1/(a+c) - 1/(b+d)) = 0.15
95 % CI of Log RR = 1.099 ± 1.96 * 0.15 = 0.81 – 1.39
95% CI of RR = exp (0.81) – exp (1.39) = 2.25 – 4.00
We wanted Relative Risk within 25% of its true value with 95% confidence level. i. e. When RR = 3, then we wanted it not to deviate from both sides by 0.75 (25% of 3), i e. 2.25 – 3.75.
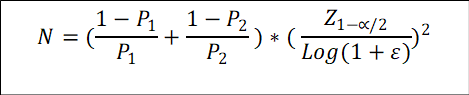
Please note that this sample size covers only one bound of the intended interval. The upper bound as per our intended precision is still out of the range. To include this bound, following formula can be used. However, this gives a large sample size, covering upper bound and increasing the precision at the lower bound. This is expected, as Log RR is normally distributed, not RR itself.
@ Sachin Mumbare